Post-Election Model Evaluation Against Actual Results: a Victory for State Polls
So, here we are, November 7, and Barack Obama has been re-elected POTUS. This came as a surprise to no-one who’s been watching the polls and following Nate Silver. Well, maybe to Dean Chambers of Unskewedpolls.com. Poor guy.
Nate did extremely well, correctly predicting all states and the overall election. He had Florida at 50/50, and here it is, still undecided because it’s so close.
And how did my humble prediction model do? Equally well! (Read yesterday’s predictions here.) Here are Nate’s and my predictions for competitive states (any state beyond 100% certainty):
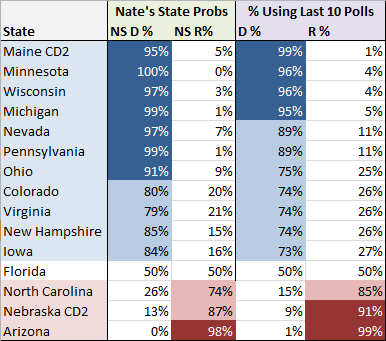
Actual winners highlighted in blue or red. The sole holdout is Florida, which we had at 50/50. Taking a look at my projected likely outcomes for an Obama win:
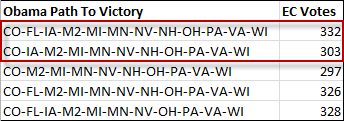
The first two paths to victory are his actual paths to victory. At the moment, CNN has Obama with 303 Electoral College votes, but if Obama wins Florida, he’ll get the 332. The outcomes above reflect the fact that Obama is slightly more likely to get Florida than not, and in actual fact this is what it’s looking like right now.
Another way to look at the accuracy of the model is to compare the computed state averages based on state polls to the actual election outcomes:
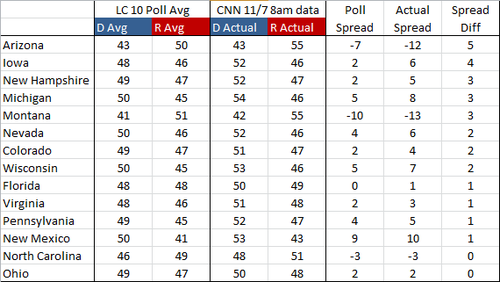
What we’re looking at here is the competitive states, sorted by how much the actual spread (based on election results) between D and R varied from the projected spread. One way to read this is that the undecideds broke more one way than the other. In Arizona, for example, the polls had Obama at 43%, which is what he actually got. Romney, however, picked up 55% of the vote instead of the projected 50%. This could be interpreted by reasoning that the additional 5% that Romney received were undecideds in the poll. The average spread difference in these competitive states was only 2 - not bad! Looks like the state polls were pretty good indicators of how the election would pan out.
Overall, my simple model did extremely well, actually surprisingly so, given how simple it is. The way it works is:
- Take the average D and R percentage and margin of error of the past X number of state polls for a given state (I’ve been using 10) for all states
- Simulate the election outcome by randomly picking a vote percentage value within the margin of error for each state, determining the winner, and allocating the appropriate number of Electoral College votes for the winner
- Do this 1,000,000 times and determine the percentage that each candidate won (or there was a tie); this is a Monte Carlo simulation to determine the probabilities of an outcome
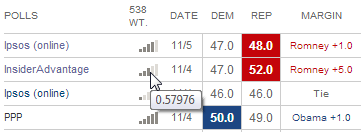
That’s basically it. How many polls to look back in this case was pretty arbitrary (10). Using a lower number gives you possibly a bit fresher set of data (the polls were taken more recently) but leaves you a bit more exposed to potential outliers. For example, if you look at my post from yesterday, you can see that using only the past 5 polls Florida had a probability of 37% Dem to 63% Rep. Here are the past 5 polls:
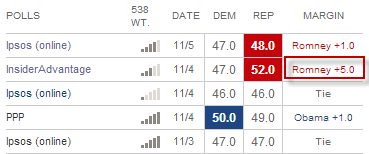
We can see here that the InsiderAdvantage poll was an outlier and had Romney at +5. Using the past 10 polls smoothed this outlier out.
What’s remarkable to me is the accuracy of this model given how dumb it is. Part of Nate’s secret sauce is his weighting of polls. You can see the weights when you hover over the little bar chart. For example, the weight given to the InsiderAdvantage polls was 0.57976 vs. 1.411115 for the PPP poll:
We don’t know exactly how these numbers are determined, but we know that variables such as time, polling house effect, sample size, etc. go into this weight. My model did none of this weighting, which is probably the first area I would start improving it. Nonetheless, the results are quite similar, so the question is, how much bang for your buck do we get from additional complexity. There’s of course also the possibility that this simple model just happened to work out, and that under different conditions a more nuanced approached would be more accurate. This is probably the more likely case. But the takeaway is that you don’t need an overly complex model to come up with some pretty decent predictions on your own.
Another area where the model fudges is in taking the average: it takes the poll averages (e.g. 50% Obama and 48% Obama averages out to 49% Obama), but it also averages the margin of error. Well, the more data you have and the larger the sample of voters that were surveyed, the smaller the margin of error will become. I did not take this fact into consideration and simply averaged the margin of errors, yielding undue uncertainty for each average. My model also did not take other factors into consideration in making the final prediction: no economic factors or national polls - just the state polls.
In all, I finish with the following observations:
- In 2012, state polls were excellent predictors of the election outcome when considered in the aggregate. It is finally time for the media to stop writing articles about single polls without putting them into the context of the larger picture. If a candidate is up by 2 points in state, we’ll see polls that show a candidate up 4 and tied. Putting out an article talking about a tied race is simply misleading.
- Nate talked about the possibility of a systemic bias in the polls. There appeared to be none when considered in the aggregate.
- A model doesn’t have to be complex to be of value and reveal underlying trends in a set of data.
- Data trumps gut feelings and intuition in making election predictions. Be wary of pundits who don’t talk about their conclusions based on what’s happening in the polls or other relevant data.
- Python rocks!