Competing with Nate Silver in Under 200 Lines of Python Code - Election 2012 Result Predictions
UPDATE: Post-election analysis here
It’s November 6, and over 18 months of grueling and never-ending campaigning is finally coming to an end. I’m admittedly a bit of a political news junkie and check memeorandum religiously to get a pulse of what’s being talked about. Together with the Chrome plugin visualizing political bias, it’s a great tool.
However, the past few years have been especially partisan and the rhetoric in the blogosphere is rancid. So it was truly a breath of fresh air when I discovered Nate Silver in the beginning of the summer. No bullshit - just the facts. What a concept! So Nate has been become the latest staple of my info diet.
He’s been catching a ton of flack in the past few months for his statistical, evidence based model that has consistently favored Obama in spite of media hype to the contrary. All of the arguments against him don’t really hold much weight unless they are actually addressing the model himself.
One article in particular caught my attention: “Is Nate Silver’s value at risk?” by Sean Davis over at The Daily Caller. His argument basically boils down to the question of whether state polls are accurate in predicting election outcomes, and whether Nate Silver’s model has relied to heavily on this data. After re-creating Nate’s model (in Excel?!), Sean writes:
After running the simulation every day for several weeks, I noticed something odd: the winning probabilities it produced for Obama and Romney were nearly identical to those reported by FiveThirtyEight. Day after day, night after night. For example, based on the polls included in RealClearPolitics’ various state averages as of Tuesday night, the Sean Davis model suggested that Obama had a 73.0% chance of winning the Electoral College. In contrast, Silver’s FiveThirtyEight model as of Tuesday night forecast that Obama had a 77.4% chance of winning the Electoral College.
So what gives? If it’s possible to recreate Silver’s model using just Microsoft Excel, a cheap Monte Carlo plug-in, and poll results that are widely available, then what real predictive value does Silver’s model have?
The answer is: not all that much beyond what is already contained in state polls. Why? Because the FiveThirtyEight model is a complete slave to state polls. When state polls are accurate, FiveThirtyEight looks amazing. But when state polls are incorrect, FiveThirtyEight does quite poorly. That’s why my very simple model and Silver’s very fancy model produce remarkably similar results — they rely on the same data. Garbage in, garbage out.
So what happens if state polls are incorrect?
It’s a good question, although Sean’s answer isn’t particularly satisfactory: he basically says we probably don’t have enough data.
However, this piqued my interest… was it really so easy to emulate his model? I wanted to find out more… the Monte Carlo plugin is $129: screw that. I bit of Googling later and it turns out Monte Carlo simulations are pretty easy to do in Python.
So after creating a few arrays to hold the latest polls for each state (via both RealClearPolitics and 538), I ran the numbers. I’ll perhaps go into the code in a separate post, but for right now, let me just post my predictions along with Nate’s.
Let’s start with state-by-state probabilities. I’ve listed Nate’s state probabilities, and then two version of my predictions. The model I’m using is really super simple. I take the average of the past X number of polls and then run the Monte Carlo simulation on those percentages and margin of errors. That’s how I come up with the state probabilities. The “Diff” column then lists the difference between my predictions and Nate’s predictions.
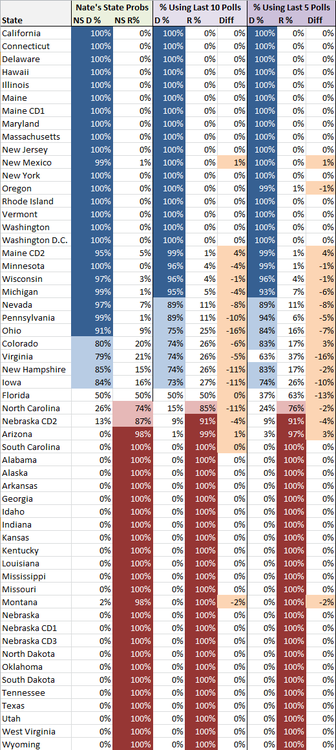
Everything is in the general ballpark, which for under 200 lines of Python code isn’t bad I think! The average difference using the past 10 polls is 5%, while the average difference using the past 5 polls is 4% (looking only at those states where our probabilities differed). Like I said, not bad, and in no case, do we predict different winners altogether (with the exception of a the 5 poll projection calling for Romney to win Florida).
So, who’s gonna win it all? Using the above percentages and simulating an election 1,000,000 times, I get the following, using first the past 10 and then then past 5 results:
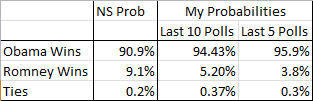
Using the 10 last polls is somewhat close to Nate, but overall, again, we’re in the same ballpark and the story being told is the same. Obama is the heavy favorite to win it tonight with roughly 10:1 odds in his favor.
Now let’s look at the most likely paths to victory for each candidate. For Obama, the following 5 paths occurred most often in the simulation:
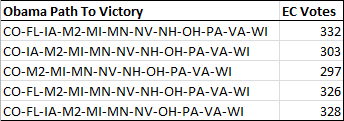
M2 here stands for Maine’s 2nd Congressional District. Maine and Nebraska apportion their Electoral Votes one for each Congressional District (Maine has 2, Nebraska 3) plus 2 for the overall vote winner.
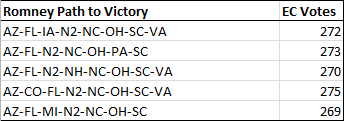
You can see why Ohio is so pivotal for Romney. Here are the most likely paths without Ohio:
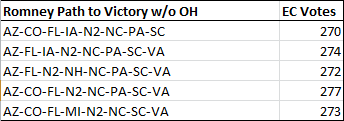
Certainly puts his late push into PA into some perspective.
Well if you do happen upon this post and are actually interested in the Python code, let me know, and I might do a follow-up post looking at the code specifically.
Cheers, and enjoy the election! I’d put my money on Obama!
UPDATE: Post-election analysis here